1. Insights – Analysis – Content Engineering 1 When Big Data and Predictive Analytics Collide: Visual Magic Happens
2. The Problem: Massive data explosion (mobile, social, wearable, cloud, m2m etc.) and brands are struggling to make use of this data. 2
4. PREDICTIVE ANALYTICS 4 Predictive Analytics enables decision makers to predict future events and proactively act on that insight to drive better business.
8. MOST COMMON PREDICTIVE MODELS • Clustering – finding groups and predicting themes • Classification – most popular “Decision tree” • Association – multi assurance connected buckets • Link Analysis – relationships • Text Mining – unstructured data to meaning • Time Series – predicting a continuous value • Graph Structure – structure predicts behavior 8
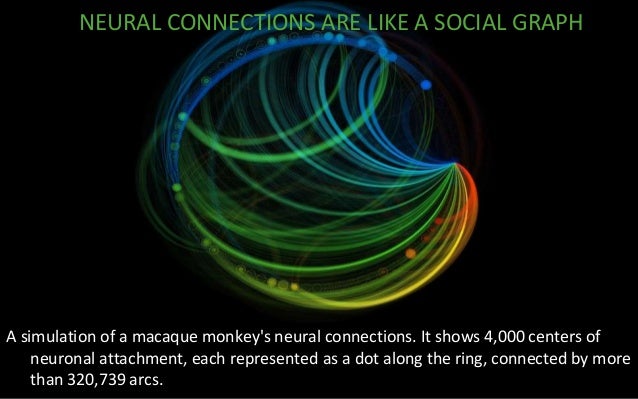
15. NEURAL CONNECTIONS ARE LIKE A SOCIAL GRAPH A simulation of a macaque monkey's neural connections. It shows 4,000 centers of neuronal attachment, each represented as a dot along the ring, connected by more 15than 320,739 arcs.
16. 3.5 BILLION WEB PAGES AND 128 BILLION HYPERLINKS • Pajek and (large) network analysis and visualization. 16 http://webdatacommons.org/hyperlinkgraph/
27. We’re Here to Help You Great Social Engagement Is About Knowing what drives engagement 27 @chasemcmichael sales@infinigraph.com @infinigraph http://smo.infinigraph.com http://www.infinigraph.com YouTube /infinigraph Slideshare /infinigraph

